One of the best things about Dygraphs is its simplicity under one of the most common circumstances - reading and rendering a CSV file from the web. And most people who use Dygraphs don't really care about data formats - they just want to graph their data. So users get unhappy when their CSV format doesn't quite fit their requirements. For example, here are some questions asked on our mailing list in the past week alone:
- Change the field separator in the CSV
- Hide columns from a CSV in the graph
- Split one CSV with four series into four separate graphs
- Combine two CSV files on one graph
If you know Dygraphs, you already know that 1, above, can most often be solved using the delimiter option (although in the user's specific case, it would not have helped, custom parsing was necessary.) And you also know that 2, above can be solved with the visibility option.
These aren't the only use cases. I recently wanted to add an additional synthetic column to my data by adding the value of two existing columns. But, as Dan recently said, Dygraphs is more about visualizing data than processing it.
Now, you might, if you've built an industrial app, just change your server code to convert your data into the format you require by adding a column, changing the delimiter, what have you. But sometimes you might not have control over the data coming from the server, or perhaps you're trying to build a one-off, and the most convenient place to make that change might be in the browser. So let's talk about what Dygraphs does when it receives a URL parameter, how it parses CSV data, and just how ridiculously easy it is for you to do it yourself.
Let's take the example of wanting to add a synthetic column: Let's say I have a CSV file called data.csv that looks like so:
Date,A,B
2012/01/01,10,10
2012/02/01,12,8
2012/03/01,13,9
2012/04/01,11,2
2012/05/01,13,5
Perfect, that's easy enough to render using the smallest bit of Javascript:
new Dygraph(div, 'data.csv');
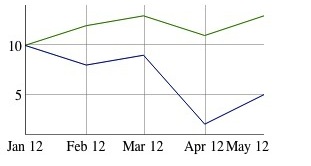
Wow, that's simple.
In our case, we're want to add a synthetic column to data.csv that takes the sum of A and B. Unfortunately, this means we can no longer have code as simple as new Dygraph(div, 'data.csv');
We're going to do three things:
1. Download the file
2. Parse its contents
3. Add the column
Downloading the file
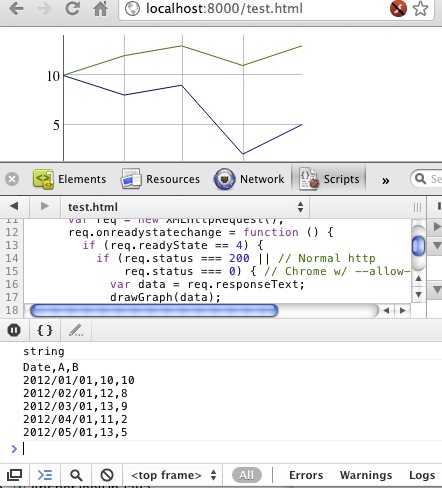
When you specify a URL (or filename) in the Dygraph constructor, it fetches the content for you using XMLHttp, the backbone of Web 2.0. Here's the snippet required to fetch the content:
var req = new XMLHttpRequest();
req.onreadystatechange = function () {
  if (req.readyState == 4) {
    if (req.status === 200 || // Normal http
        req.status === 0) { // Chrome w/ --allow-file-access-from-files
      var data = req.responseText;
      drawGraph(data);
    }
  }
};
req.open('GET', 'http://localhost:8000/data.csv', true);
req.send(null);
var drawGraph = function(data) {
  console.log(typeof(data));
  console.log(data);
  new Dygraph(div, data);
}
I added the console.log at the end just to demonstrate that the data is a String representation of the file.
I'm not going to go into detail about the XMLHttpRequest API - that's for experts in that domain to handle, and also, this document covers it. Suffice it to say that the callback is required since the XMLHTTPRequest is asynchronous. You can also read the private function start_ in dygraph.js.
Parsing the contents
So that first part wasn't so bad. Parsing the contents is going to be similarly easy. We're going to turn the CSV into an array. Go read the section in the Dygraphs Data Format document on arrays, and pay close attention to this piece of text:If you want your x-values to be dates, you'll need to use specify a Date object in the first column. Otherwise, specify a number. Here's a sample array with dates on the x-axis:So since in this case, the first column is a date, we'll have to turn it the values in the first column into Date objects, and turn our subsequent values into numbers.
var toArray = function(data) {
  var lines = data.split("\n");
  var arry = [];
  for (var idx = 0; idx < lines.length; idx++) {
    var line = lines[idx];
    // Oftentimes there's a blank line at the end. Ignore it.
    if (line.length == 0) {
      continue;
    }
    var row = line.split(",");
    // Special processing for every row except the header.
    if (idx > 0) {
      row[0] = new Date(row[0]); // Turn the string date into a Date.
      for (var rowIdx = 1; rowIdx < row.length; rowIdx++) {
        // Turn "123" into 123.
        row[rowIdx] = parseFloat(row[rowIdx]);
      }
    }
    arry.push(row);
  }
  return arry;
}
You'll also need to split out the header row as the labels option.
var drawGraph = function(data) {
  var arry = toArray(data);
  var firstRow = arry[0];
  var data = arry.slice(1); // Remove first element (labels)
  new Dygraph(div,data, { labels: firstRow });
}
This code sample doesn't address all cases for parsing. For instance, it
expects the first column to be a date string. If you want to know more
about how Dygraphs parses CSV, read the parseCSV_ function in dygraph.js.Adding the column
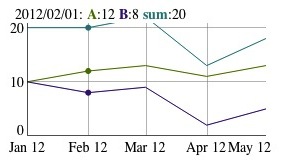
Now we have an array, it should be dead simple to add the additional column. Here's what we know:- The first row contains the headers, so we'll need to add an additional element to the header array.
- Each subsequent row in the array contains data, and those values will be in the row's second and third elements (indexes 1 and 2.)
var drawGraph = function(data) {
  var arry = toArray(data);
  var firstRow = arry[0];
  var data = arry.slice(1);
  firstRow.push("sum");
  for (var idx = 0; idx < data.length; idx++) {
    var row = data[idx];
    var sum = row[1] + row[2];
    row.push(sum);
  }
  new Dygraph(div,data, { labels: firstRow });
}
Addenda
- Oftentimes, people ask about the ability bypass the browser cache when fetching data to ensure the graph is always up to date. Since it's of related interested, I've included a reference to bypassing the cache here.
- Javascript libraries simplify the work around XMLHttp, so instead of having to write all the code above, you might want to invest some time in using jQuery (with its ajax function) or the Closure library.
- Don't forget that the URL you request for data needs to be on the same domain as the page requesting it, otherwise your XHR will be rejected.
- Javscript's parseFloat is not precisely the same as Dygraphs' own parseFloat_ method. Read the code for details.