Wednesday, January 18, 2012

Preventing Dygraphs Memory Leaks

As a matter of cosmic history, it has always been easier to destroy than to create." - Spock

Spock is the kind of guy who preferred C++ with its destructors (let alone multiple inheritance), and that quote clinches it.


But it's also pretty easy to destroy in Dygraphs, you just have to remember to do it. And if you don't remember, you might have to pay a penalty.

Have you used the Dygraphs benchmark? It's a great tool for validating that your browser can handle large loads of dygraphs data. For instance, here's a URL that generates 50,000 points of data, which it tends to render in about half a second:

http://dygraphs.com/tests/dygraph-many-points-benchmark.html?points=100&series=500

Actually, today we aren't going to talk about Spock, or speed, we're going to talk about memory leaks.

Thanks to an excellent post on using the Chrome Inspector to diagnose and find memory leaks, we can see. Read that post to see how to track memory consumption. For this test, I used the URL above, and clicked "Go!" five times in a row (as opposed to setting repetitions=5)


Notice how over time, memory seems to go up, and never down. A sure sign of a memory leak.
The post also covers the notion of heap snapshots and how to compare multiple snapshots. So as a follow-up I took a heap snapshot, clicked "Go!" once, took another snapshot, and compared them.


So, the number of graphs increased by two. That means the browser is holding on to two more instances of Dygraph, DygraphLayout, DygraphCanvasRenderer, you name it, with each new rendering. That could be the cause of our memory leak! (Remember that the benchmark shows two graphs, one which is benchmarked, and another one to show the values of each benchmark test.)

Let's see how the graphs are created in dygraph-many-points-benchmark:

  plot = new Dygraph(plotDiv, data, opts);

  new Dygraph(
      document.getElementById('metrics'),
      durations,
      { ... });

The first one, upon deeper inspection, might be assigned to a local variable, but the variable is never used. In other words, with every iteration, that graph is just forgotten about.

That's about when Dan told me about Dygraph.destroy. According to the method's documentation:
Detach DOM elements in the dygraph and null out all data references. Calling this when you're done with a dygraph can dramatically reduce memory usage. See, e.g., the tests/perf.html example.
So I address that first case with the following change:
 
   if (plot) { plot.destroy(); }
   plot = new Dygraph(plotDiv, data, opts);


So now, before re-rendering the benchmark graph, the old graph is destroyed.

That second example, the one which stores durations of each benchmark, isn't even stored somewhere to be destroyed at a later time. However, rather than dispose that graph each time, I did something slightly different:

  var metrics = null;

  if (!metrics) {
    metrics = new Dygraph(
        document.getElementById('metrics'),
        durations,
        { ... });
  } else {
    metrics.updateOptions({file: durations});

Here, instead of destroying and recreating the graph, I just reuse it, pushing in new values using the file option.

The result?


Steady memory usage. You can see a temporary bump which occurred at a period where I clicked Go! a little too quickly but even that memory was reclaimed. If you zoom in on the image, you can see small hiccups in the memory use every time I regenerated the graphs.

The takeaways:
  • Don't assume your graphs are being destroyed when you no longer hold references to them.
  • Hold references to your graphs so you can destroy them with Dygraph.destroy.
  • Use updateOptions to replace graph data rather than constantly build new graphs.
  • Go read the post on diagnosing memory leaks in Chrome. Go.

Monday, January 16, 2012

Introducing the Dygraphs Gallery

I'd like to introduce you to the new Dygraphs Gallery, which can be found at http://dygraphs.com/gallery. We've taken some of the existing tests, cleaned them up a bit, and put them into a single easy-to-use web application.

In 2009, Dygraphs' tests directory was used mostly for verifying that the code hadn't broken, by examining each 'test' one at a time. The list of tests grew to over seventy strong. With the advent of the Dygraphs automated test framework, the tests directory was less a home for validating behavior (which, anyway, became rather unwieldy with so many of them) and more of a showcase of what's possible in small, discrete packages.

So rather than have a series of independent files, we modeled the gallery after the GWT Showcase, including showing the code required to make the demo.
The code behind each demo is there for your perusal.
With the new Gallery, the old-fashioned Dygraphs tests face a different future, either being turned into Gallery demos, automated tests, or deleted outright.

The Dygraphs Gallery is brand new, and we have more demos and features to add. If you have any thoughts on the matter, don't hesitate to let us know on the mailing list, or, as always, contributions are welcome.

Sunday, January 8, 2012

New Dygraphs Toy: the Palette

Happy New Year! I've been working on this for the last few days and am super excited it's finally ready to show. If you've wanted to learn how Dygraphs options work, then this will probably excite you too: the Dygraphs Options Palette, available at dygraphs.com/experimental/palette. It's easy, fun, and useful.

I've tested it with Chrome and Firefox/OSX. If you have a different browser, please give it a shot.

Major Features:
  • Make changes to a graph, live.
  • Support for most Dygraphs options (see below for details)
  • Live interaction with several predefined data sets.
  • Supports almost all Dygraphs data types, including string, int, float, boolean, string array, int array, boolean array, and function. (DOM element and dictionary are missing.)
  • Pretty integrated option help.
  • Designed with simple user experience in mind.
What's Left:
  • Not all options are supported. Some options, like labelsDiv and interactionModel are probably easy to support, but axis-specific options require more work.
  • While you can use one of the canned data sources, this palette should really work with user-supplied data sources.
  • Support for other browsers.
  • Exporting a set of options as a URL, or even a Javascript code snippet.
  • Graduate the palette into a full-featured library which can be easily applied to live graphs.

Stop reading, and go play with the options palette, available at dygraphs.com/experimental/palette. Feedback is welcome, and code is too.

Screen Captures


You can filter down the gigantic set of options and apply them appropriately.

In this example I've taken the basic graph and set the options drawPoints: true and pointSize: 5
And now I've changed the series colors using  colors: red, green, blue, black.

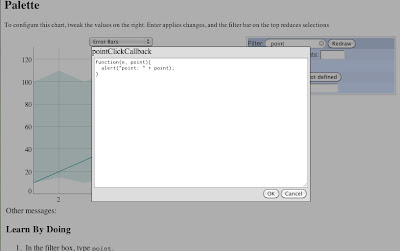
And can set all kinds of values, even callbacks.

And there's lots of tooltip help. Just hover over the lines.

Saturday, January 7, 2012

New Developer Feature: easier localized testing

If you're developing for Dygraphs, then you should know that we like tests. We've currently got 93 automated tests in the github repository (found at auto_tests/tests) and built an automated test suite thanks to JSTestDriver. We strongly encourage people to run the test suite when making Dygraphs changes (which is well documented in auto_tests/README.)

However, I've made interim testing much simpler. If you're not already familiar with auto_tests/misc/local.html, it's a hacked-down version of the automated test framework that you can easily run locally in any browser. This is particularly useful for debugging a broken test.

However, debugging those tests required a javascript console, and you had to know the name of the test you wanted to run. Now it's much simpler, as local.html will present you with a list of all test cases you can choose to run.


From there you can select an individual test case. Here, I've selected "to-dom-coords":


You can run one test, or all of them. Below you can see the results of running all the tests, with the output of the last test still on the document.

But if you want, you can run all the tests from all the cases!
And you'll get a long list of results to peruse at your pleasure.


Keep in mind that in-browser testing is not as thorough a test as running through JSTestDriver. This means that you still need to run the automated test suite when you can.

(Note: I know this works with Chrome, it might not work with your browser. Please let me know if it doesn't, or better, submit a patch!)