I've tested it with Chrome and Firefox/OSX. If you have a different browser, please give it a shot.
Major Features:
- Make changes to a graph, live.
- Support for most Dygraphs options (see below for details)
- Live interaction with several predefined data sets.
- Supports almost all Dygraphs data types, including string, int, float, boolean, string array, int array, boolean array, and function. (DOM element and dictionary are missing.)
- Pretty integrated option help.
- Designed with simple user experience in mind.
What's Left:
Stop reading, and go play with the options palette, available at dygraphs.com/experimental/palette. Feedback is welcome, and code is too.
Screen Captures
- Not all options are supported. Some options, like labelsDiv and interactionModel are probably easy to support, but axis-specific options require more work.
- While you can use one of the canned data sources, this palette should really work with user-supplied data sources.
- Support for other browsers.
- Exporting a set of options as a URL, or even a Javascript code snippet.
- Graduate the palette into a full-featured library which can be easily applied to live graphs.
Stop reading, and go play with the options palette, available at dygraphs.com/experimental/palette. Feedback is welcome, and code is too.
Screen Captures


And now I've changed the series colors using colors: red, green, blue, black.


And can set all kinds of values, even callbacks.
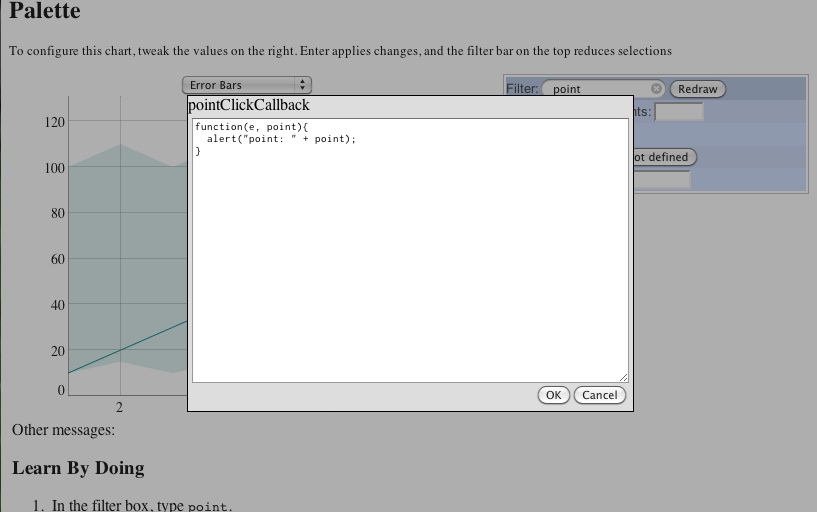
And there's lots of tooltip help. Just hover over the lines.

No comments:
Post a Comment