(Guest post by Zach Dischner)
The IPython Notebook is an excellent tool for interacting with Python and displaying data in real time. While tools like matplotlib can generate static plots in an IPython Notebook, we often find their plots to be slow to render and the minimal interactivity limits their usefulness in practice. Being a long time fan of dygraphs, we wrote a module to render the JavaScript plots in the Notebook. This module can be readily included in an IPython Notebook and then used to generate beautiful, fast, and interactive time series plots with dygraphs, all stored locally with no need for remote hosting.
PyDyGraphs is far from mature, but what proved to be a simple effort of integrating the DyGraphs library into the Notebook environment has already been enormously useful and fun to use. The whole thing only took a day or two to write, and has become my new go-to plotting tool for time-series data.
Purpose
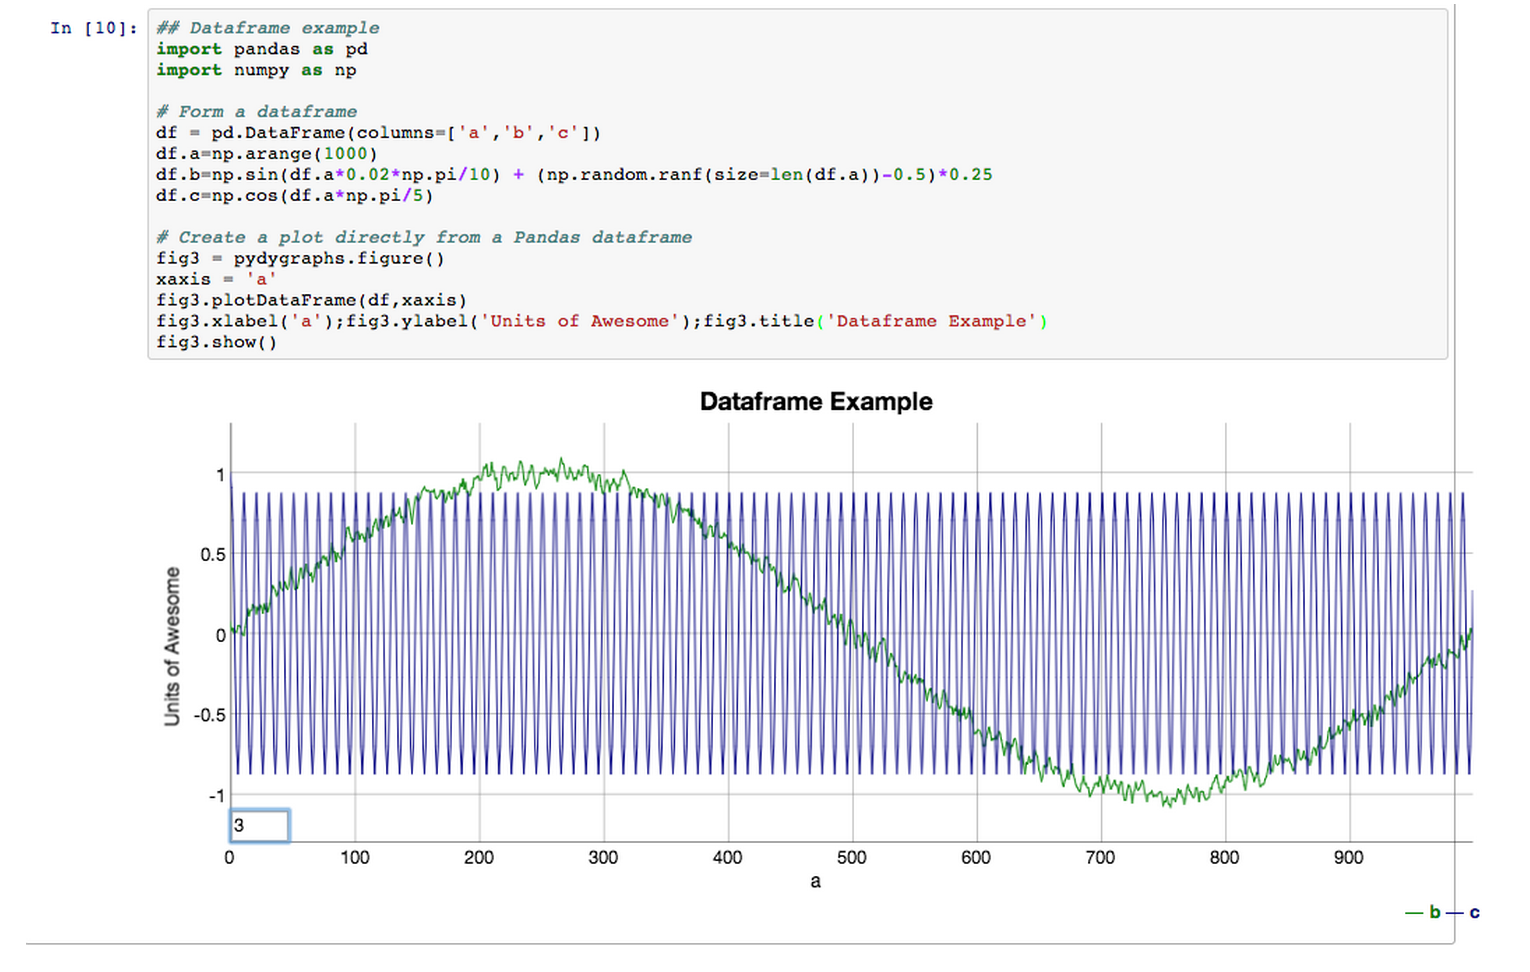
Originally, PyDyGraphs was meant as a Pandas Dataframe plotter. The Dataframe is a powerful data structure, and the lack of an adequate visualization tool lead to the creation of the PyDyGraphs plotting module. The Dataframe is already a relational data structure, and is easily provided to Dygraphs for visualization. Support for typical time series arrays has been added, but those simply get translated to DataFrames along the way.
I am one of the lead software developers and main instrument operator on the BRRISON/BOPPS high altitude balloon mission. With flight times on balloon missions potentially being limited to hours, immediate and intuitive interpretation of flight telemetry is absolutely essential in order to make the fast decisions needed to maximize achievement of science goals. We found that matplotlib figures were simply too slow and too static for our needs. Hence PyDyGraphs! We created the module to follow the same basic behavior as matplotlib, but give you much of the awesome functionality of dygraphs.
Enough words, here are some examples.
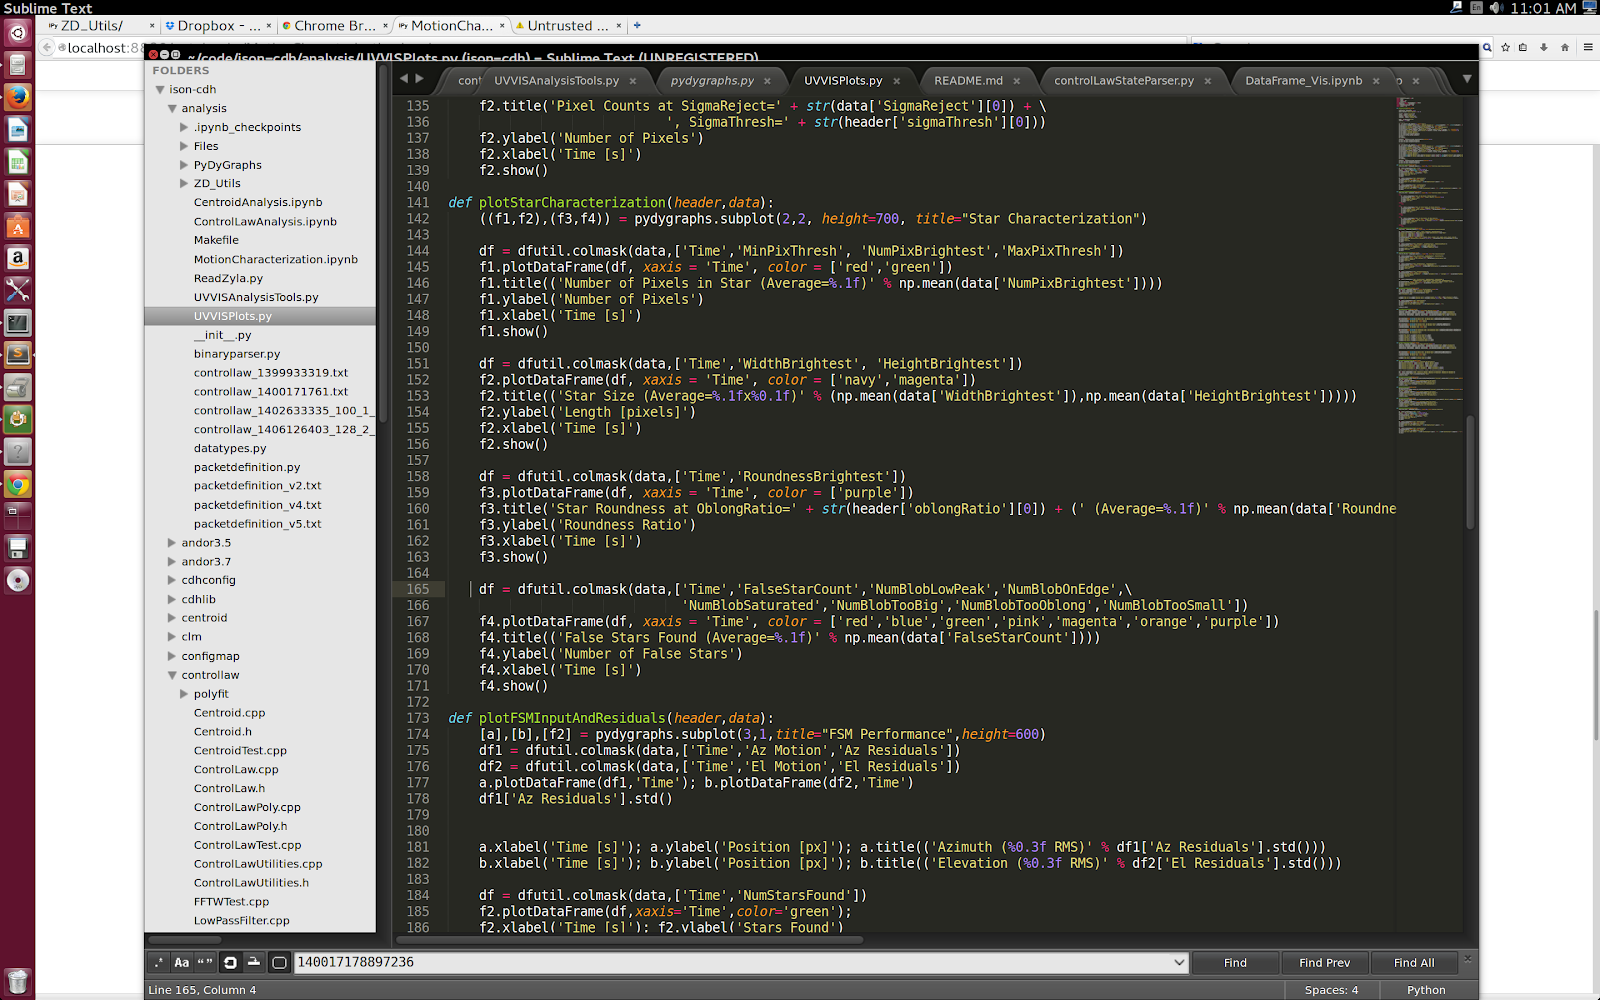
2x2 subplot
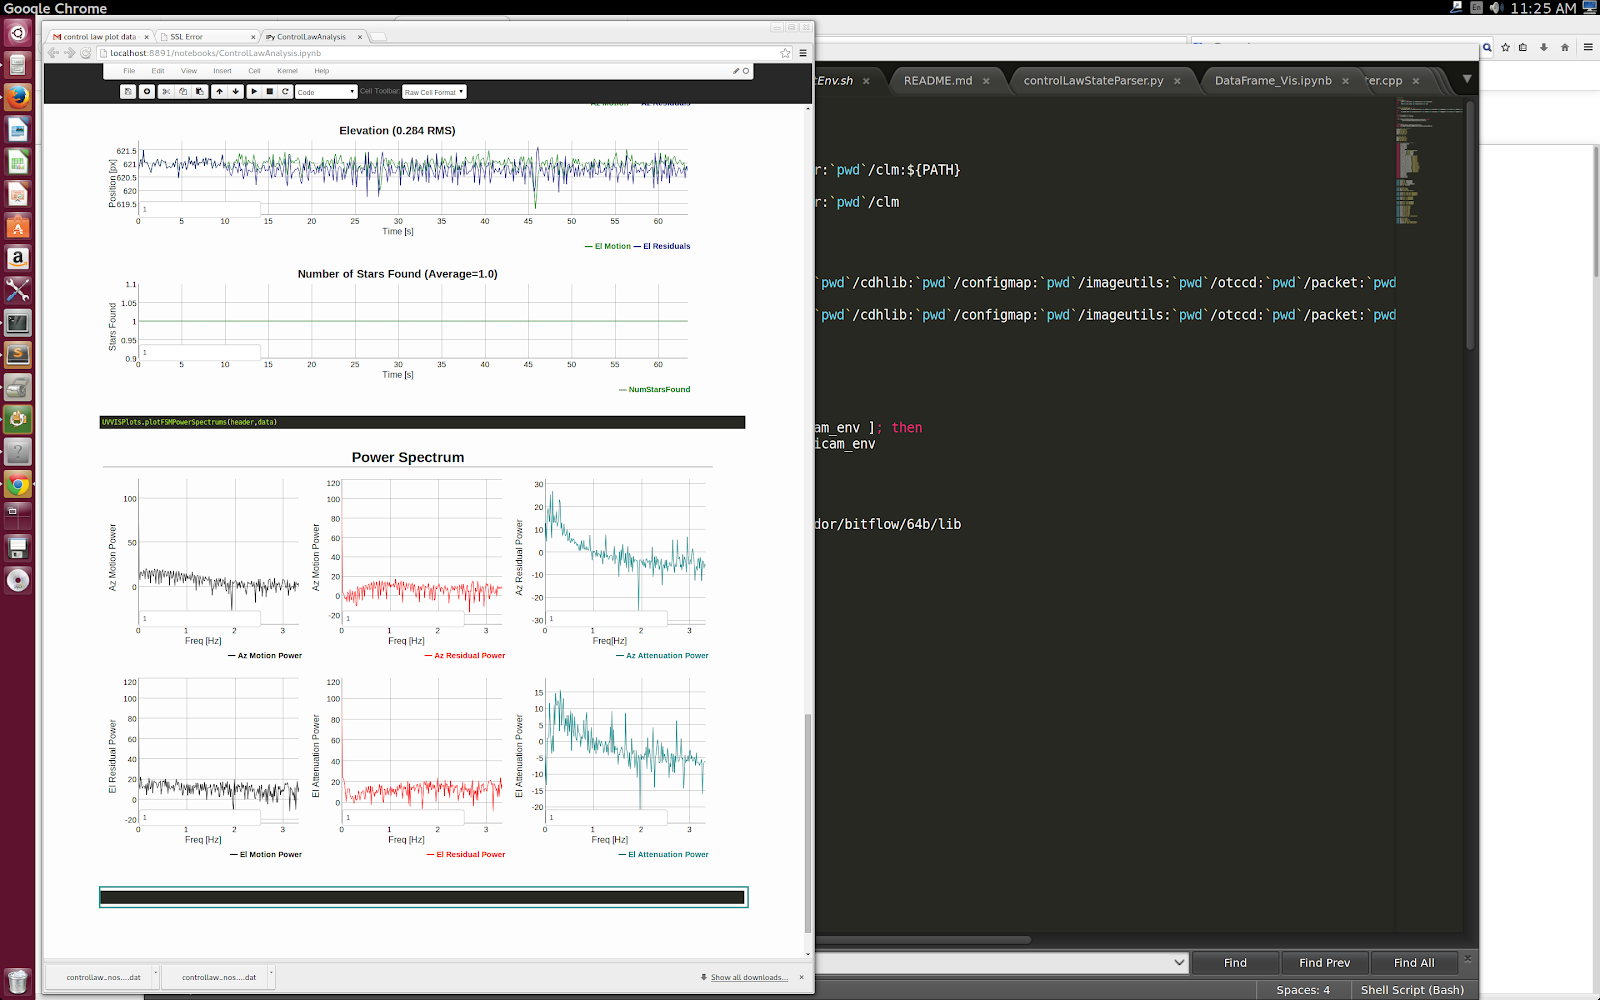
Similarly 3x3 Plot
How it Works
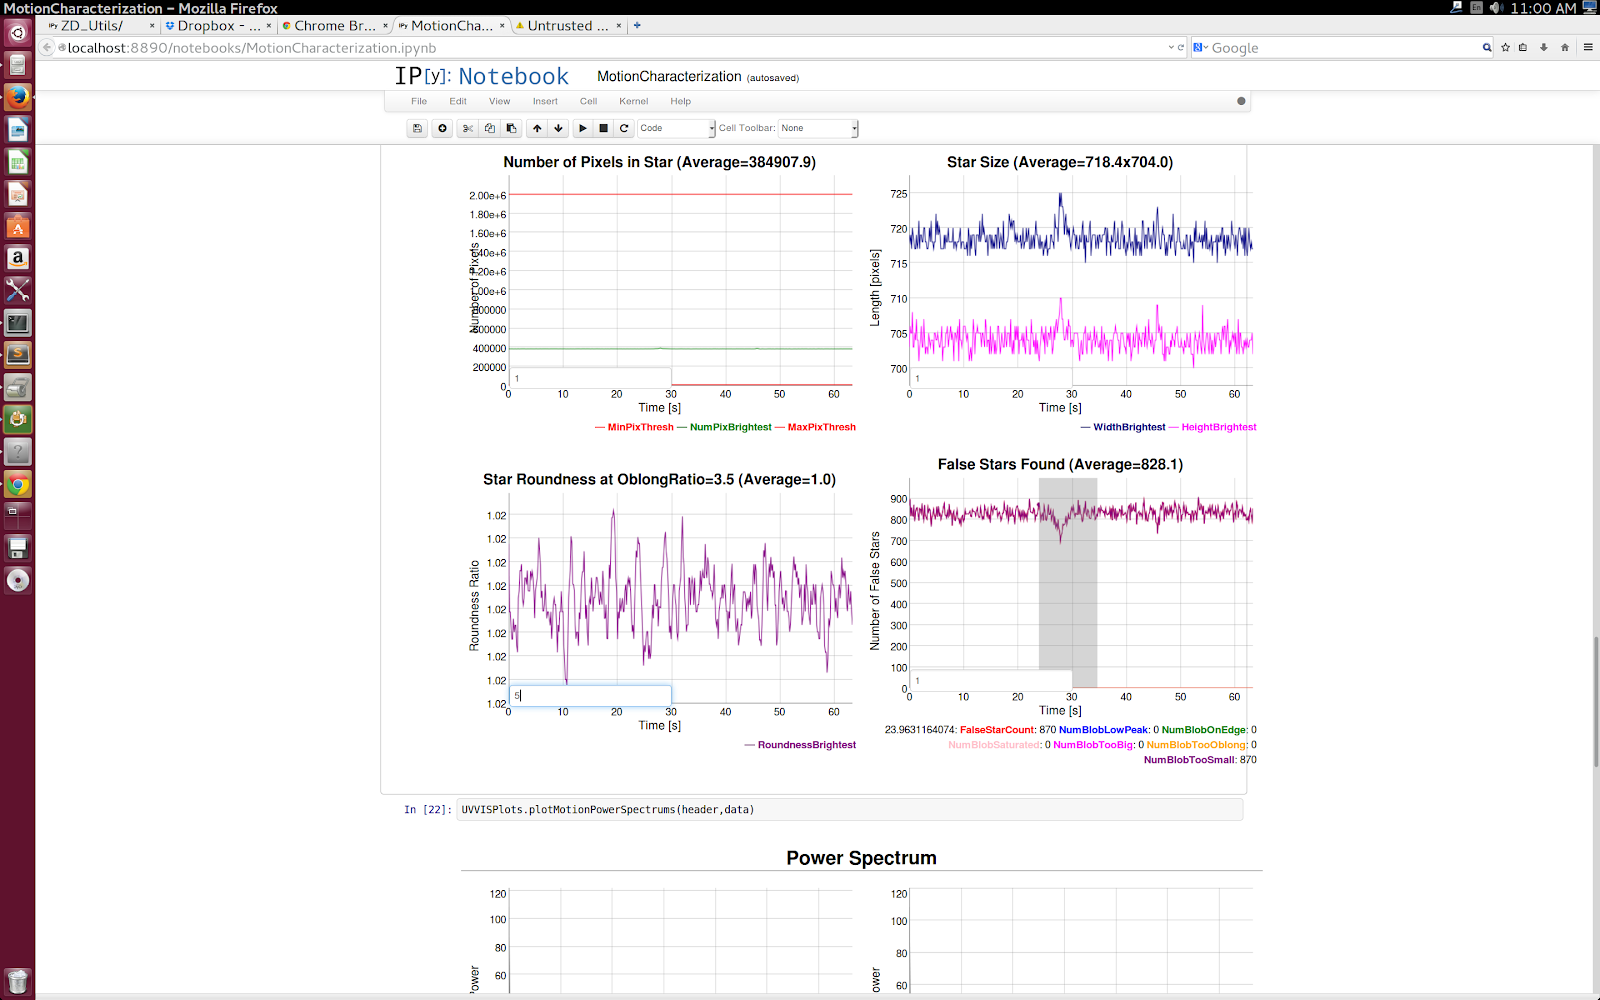
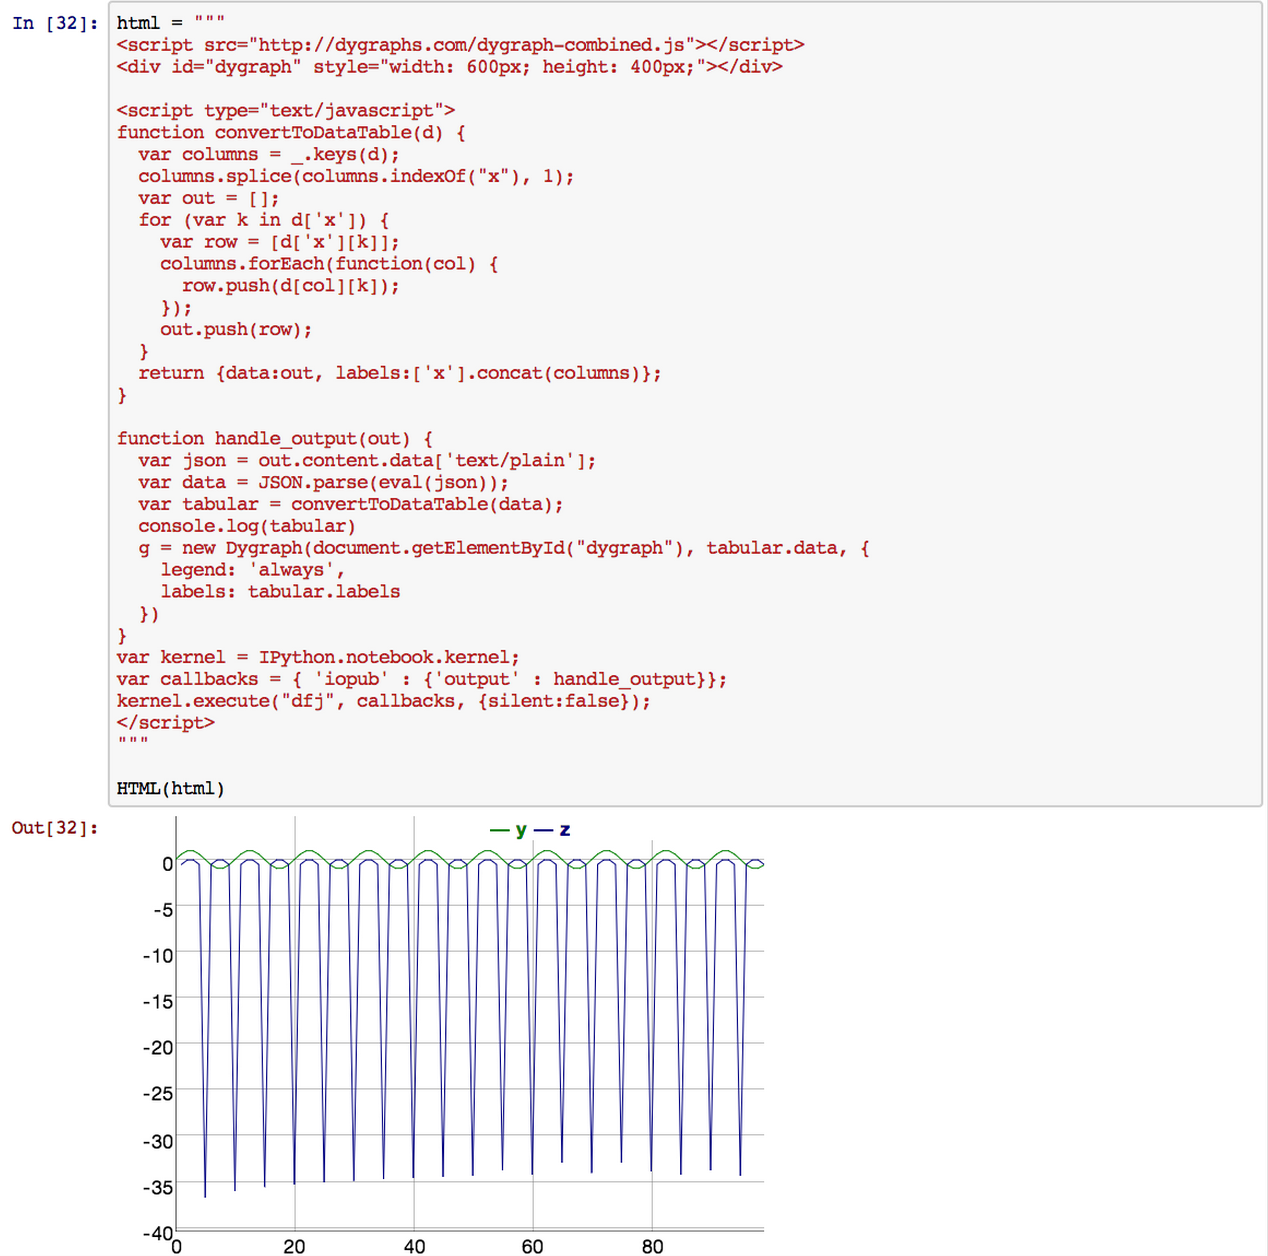
At its core, this module creates a JavaScript string for use within an IPython Notebook. It takes advantage of the Notebook’s built in “Kernel” and “Callback” JavaScript interactivity tools to get data between Python and JavaScript. We based it off of this SO question (thanks danvk!)
Conclusion
PyDyGraphs is a simple, easy to use wrapper of the epic dygraphs plotting library. We are using it for personal and professional projects, and are just plain stoked about being able to mix Python/dygraphs.
For more examples, check out our github: https://github.com/DayStarEngineering/PyDyGraphs
There are plenty of todos and ideas, so feel free to fork and contribute.