One of the best things about Dygraphs is its simplicity under one of the most common circumstances - reading and rendering a CSV file from the web. And most people who use Dygraphs don't really care about data formats - they just want to graph their data. So users get unhappy when their CSV format doesn't quite fit their requirements. For example, here are some questions asked on our mailing list in the past week alone:
- Change the field separator in the CSV
- Hide columns from a CSV in the graph
- Split one CSV with four series into four separate graphs
- Combine two CSV files on one graph
If you know Dygraphs, you already know that 1, above, can most often be solved using the delimiter option (although in the user's specific case, it would not have helped, custom parsing was necessary.) And you also know that 2, above can be solved with the visibility option.
These aren't the only use cases. I recently wanted to add an additional synthetic column to my data by adding the value of two existing columns. But, as Dan recently said, Dygraphs is more about visualizing data than processing it.
Now, you might, if you've built an industrial app, just change your server code to convert your data into the format you require by adding a column, changing the delimiter, what have you. But sometimes you might not have control over the data coming from the server, or perhaps you're trying to build a one-off, and the most convenient place to make that change might be in the browser. So let's talk about what Dygraphs does when it receives a URL parameter, how it parses CSV data, and just how ridiculously easy it is for you to do it yourself.
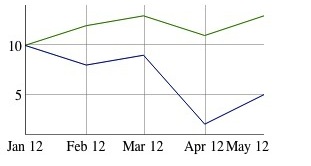
Let's take the example of wanting to add a synthetic column: Let's say I have a CSV file called data.csv that looks like so:
Date,A,B
2012/01/01,10,10
2012/02/01,12,8
2012/03/01,13,9
2012/04/01,11,2
2012/05/01,13,5
Perfect, that's easy enough to render using the smallest bit of Javascript:
new Dygraph(div, 'data.csv');
Wow, that's simple.
In our case, we're want to add a synthetic column to data.csv that takes the sum of A and B. Unfortunately, this means we can no longer have code as simple as new Dygraph(div, 'data.csv');
We're going to do three things:
1. Download the file
2. Parse its contents
3. Add the column
Downloading the file
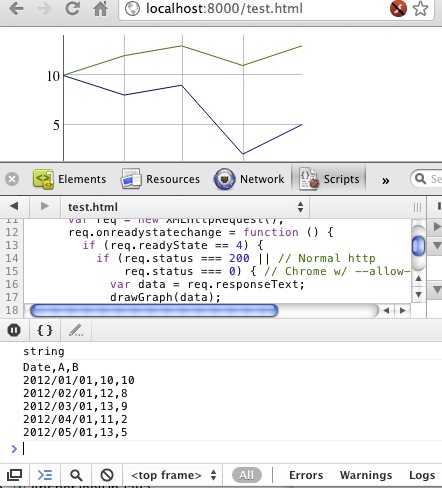
When you specify a URL (or filename) in the Dygraph constructor, it fetches the content for you using XMLHttp, the backbone of Web 2.0. Here's the snippet required to fetch the content:
var req = new XMLHttpRequest();
req.onreadystatechange = function () {
  if (req.readyState == 4) {
    if (req.status === 200 || // Normal http
        req.status === 0) { // Chrome w/ --allow-file-access-from-files
      var data = req.responseText;
      drawGraph(data);
    }
  }
};
req.open('GET', 'http://localhost:8000/data.csv', true);
req.send(null);
var drawGraph = function(data) {
  console.log(typeof(data));
  console.log(data);
  new Dygraph(div, data);
}
I added the console.log at the end just to demonstrate that the data is a String representation of the file.
I'm not going to go into detail about the XMLHttpRequest API - that's for experts in that domain to handle, and also, this document covers it. Suffice it to say that the callback is required since the XMLHTTPRequest is asynchronous. You can also read the private function start_ in dygraph.js.
Parsing the contents
So that first part wasn't so bad. Parsing the contents is going to be similarly easy. We're going to turn the CSV into an array. Go read the section in the Dygraphs Data Format document on arrays, and pay close attention to this piece of text:If you want your x-values to be dates, you'll need to use specify a Date object in the first column. Otherwise, specify a number. Here's a sample array with dates on the x-axis:So since in this case, the first column is a date, we'll have to turn it the values in the first column into Date objects, and turn our subsequent values into numbers.
var toArray = function(data) {
  var lines = data.split("\n");
  var arry = [];
  for (var idx = 0; idx < lines.length; idx++) {
    var line = lines[idx];
    // Oftentimes there's a blank line at the end. Ignore it.
    if (line.length == 0) {
      continue;
    }
    var row = line.split(",");
    // Special processing for every row except the header.
    if (idx > 0) {
      row[0] = new Date(row[0]); // Turn the string date into a Date.
      for (var rowIdx = 1; rowIdx < row.length; rowIdx++) {
        // Turn "123" into 123.
        row[rowIdx] = parseFloat(row[rowIdx]);
      }
    }
    arry.push(row);
  }
  return arry;
}
You'll also need to split out the header row as the labels option.
var drawGraph = function(data) {
  var arry = toArray(data);
  var firstRow = arry[0];
  var data = arry.slice(1); // Remove first element (labels)
  new Dygraph(div,data, { labels: firstRow });
}
This code sample doesn't address all cases for parsing. For instance, it
expects the first column to be a date string. If you want to know more
about how Dygraphs parses CSV, read the parseCSV_ function in dygraph.js.Adding the column
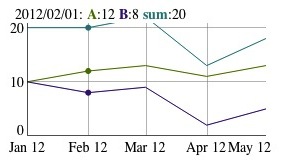
Now we have an array, it should be dead simple to add the additional column. Here's what we know:- The first row contains the headers, so we'll need to add an additional element to the header array.
- Each subsequent row in the array contains data, and those values will be in the row's second and third elements (indexes 1 and 2.)
var drawGraph = function(data) {
  var arry = toArray(data);
  var firstRow = arry[0];
  var data = arry.slice(1);
  firstRow.push("sum");
  for (var idx = 0; idx < data.length; idx++) {
    var row = data[idx];
    var sum = row[1] + row[2];
    row.push(sum);
  }
  new Dygraph(div,data, { labels: firstRow });
}
Addenda
- Oftentimes, people ask about the ability bypass the browser cache when fetching data to ensure the graph is always up to date. Since it's of related interested, I've included a reference to bypassing the cache here.
- Javascript libraries simplify the work around XMLHttp, so instead of having to write all the code above, you might want to invest some time in using jQuery (with its ajax function) or the Closure library.
- Don't forget that the URL you request for data needs to be on the same domain as the page requesting it, otherwise your XHR will be rejected.
- Javscript's parseFloat is not precisely the same as Dygraphs' own parseFloat_ method. Read the code for details.
your blog is nice & effective.
ReplyDeleteDygraphs are you explain with coding portion yhat is nice and add a extra future.
Thanks for sharing.
offshore software web development
Thank you for the Date object hint!!
ReplyDeleteAdding a column with different start/end position and interval can be a lot of work in case of a large dataset, highcharts (http://www.highcharts.com/demo/) has a dataset per series approach which allows to add series dynamically, but this may be at the cost of performance.
ReplyDeleteqman, you're definitely right. Injection of a single value isn't necessarily simple with Dygraphs. But that's not been a frequent requirement. I don't even think there's a bug open for it. (Maybe you should open a bug!)
ReplyDeleteAnd to be honest, Highcharts might not be interested in loading hundreds of thousands of points - it's not wrong to argue under certain circumstances that if you're loading that much data, perhaps you're doing it wrong. For me, performance is often a big issue because for my main project it's possible to load several graphs with large datasets. It's not our fault when graphs are drawn slowly, and yet, it is.
I am investigating how the ulr dygraphs pass a google docs document in csv format but I am unable to find the solution. Could help me??
ReplyDeletefessa, It sounds like this is a problem that requires using the Google Docs API, and not specific to Dygraphs. Sorry.
ReplyDeleteThank you for your answer.But you could spend an example of how to use Dygraphs by passing the data to a URL.
ReplyDeleteI would like to see an option to use Dygraphs as a local html application, without using any web-server. The file:/// protocol is really unusable when one needs to use a local data file. I suppose having a feature like pasting data into a form that uses javascript based form submit, can do the trick.
ReplyDeleteManish, there's no option that will do that. That is a fundamental browser security issue. If you can figure out a way to do it, feel free to let us know.
ReplyDeleteThere is a plugin to add CORS headers to any Firefox request. In Google chrome you can use the command line option --disable-web-security -- obviously this makes the browser insecure in both cases. Though I suppose it would be okay if not used for internet browsing.
ReplyDeleteI'm very interested in getting your library working for Red Lion Crimson/HC900 to plot industrial data. This is coming along -- main issue was getting time/date 'combined' into one row, as the control system stores them separately so it required parsing of course. I particularly like the zoom capabilities and auto-scaling. Great work!
Frank, thanks for your comment. You know, I'd like to vastly simplify this case, so people don't have to take all three steps above. Like the top of the article says, Dygraphs just isn't really about parsing data, it's power is in visualizing it. I'm confident you'll be able to get your parsable data details sorted out. Any other problems that you may have should be brought up on the mailing list. Good luck!
ReplyDeleteRobert, I ended up getting it working without any plugins, simply by placing the javascript code in a parent directory, thereby making the subdirectories with the CSV files, accessible via XMLHTTP request without any cross-domain problems. It works extremely well. Your library is exceptional. The ability to 'checkbox' trends and zoom is quite nice. Any tips on debugging javascript? It works in Firefox but not IE8 which says 'script errors'. It works in IE9. I'm assuming those issues are with my code.
ReplyDeleteCongratulations, Frank! This is definitely the kind of thing that should be brought up on the mailing list.
ReplyDeleteAlso, I haven't touched IE8 in years, so I just couldn't say. Googling for [debug ie8 javascript] would be my first step, though.
Robert: I just wanted to thank you AGAIN for this fabulous library. I switched companies and am AGAIN using it to visualize industrial data -- this time, with Allen Bradley RSVIEW32. I was having speed problems with the database for large time series -- e.g. a single reactor pressure records every minute, and there are 500+ points, so tables grow quickly. I originally used MSSQL but the 'Express' version threw errors when I indexed fields & I couldn't partition either with the 'free' version. I switched to mySQL and couldn't be happier. I partitioned data into 2 day intervals and it is lightning fast now since all queries are date-based. I thought I'd pass this on in case others are trying to use it in similar applications. In industrial control systems, every 'point' has a tag name, so I have jquery autocomplete, e.g. to view LE505 Seal Fluid Tank, I type '505' and it shows me only the tags with 505 in the dropdown. I realize this doesn't pertain to dygraphs explicitly but I did want to note it as another successful use case. One other thing I did find: I work in Engineering, not IT, I wasn't given a webserver. Even so, I was able to get dygraphs to query a SQL server using ACTIVEX from Javascript, so the library can be used that way as well. I did finally get a test webserver going and am going to write it all to run on server end now.
ReplyDeleteOne other question I did have, is there an extension to calculate slopes or integrate? That would be especially useful in the process industries, and, surprisingly, is a feature lacking even in expen$ive control system plotting packages such as provided by Rosemount DeltaV. Slope would be for change in tank levels/temperatures, integration, to aggregate flow rates over time for a total processed. Some of this can be done by a PLC but it would be great if I could just hit a button and do a first derivative. I suppose I could code some javascript to do that and may give that a shot.
Frank, I'm glad Dygraphs is working so well for you. I don't think there's good support for calculating slopes or integration, though there are some features that might already do similar work for you. I honestly think you best choice is to ask on the mailing list at https://groups.google.com/forum/#!forum/dygraphs-users
ReplyDeleteRobert: I was able to alter the Dygraphs linear regression example to do EXACTLY what I wanted with slopes, it works great. That must be a new example; I did not see it last time I was on the site? I simply added a DIV and after it plots the line, I put the slope per min, hour, and day in the DIV. Makes it easy to read tank level changes/gallons processed. That example is great in the way it processes ONLY the zoomed upon data & I can easily alter it to integrate or take an average. I moved the entire database to mySQL and partitioned it by date, so it plots very quickly -- this sped up execution tremendously (partition pruning large dataset from RSVIEW32/Allen Bradley PLC datalogs) since most of my queries are against the last 8 hours or day or two of data. I also switched over to ASP to fetch the data, so now it works in Firefox, Chrome, etc without ActiveX required. This library is so much better than TrendX or even DeltaV because it is customizable.
ReplyDeleteI frequently run dygraphs from XL and MSAccess to build websites based purely on html and javascript (on secure intranet sites), NO WEB server. You can build the html file complete with your data using the VB editor in Excel and write to a html file. The file will open with browsers that support dygraphs.
ReplyDeleteAdditionally, I use ADO with javascript to do exactly the same thing which gives the versatility of using SQL queries to retrieve the data from XL spreadsheets or Access DBs, again, no web server
I'm not sure if this is the best place to post this, but I had two questions about Dygraphs:
ReplyDelete1.) I'd like to plot lab data sampled less frequently (say, twice a day) against 'process' data sampled every minute. How is this achieved other than by stacking two plots? I'd prefer to put them on same plot.
2.) I have 630 parameters, sampled once a minute, I currently have table partitioned in 2-day chunks in mySQL, am I better off partitioning it on parameters (630 partitions)? Typical use case, comprises plotting one or 2 parameters across a day, week, month, or year.
please!!!, i want a question?
ReplyDeletedygraph documentation say that:
"ylabel
Text to display to the left of the chart's y-axis. You can supply any HTML for this value, not just text. If you wish to style it using CSS, use the 'dygraph-label' or 'dygraph-ylabel' classes. The text will be rotated 90 degrees by default, so CSS rules may behave in unintuitive ways. No additional space is set aside for a y-axis label. If you need more space, increase the width of the y-axis tick labels using the yAxisLabelWidth option. If you need a wider div for the y-axis label, either style it that way with CSS (but remember that it's rotated, so width is controlled by the 'height' property) or set the yLabelWidth option.
Type: string
Default: null
Gallery Samples: border demo range-selector styled-chart-labels temperature-sf-ny two-axes
Other Examples: border demo legend-formatter multi-scale plugins range-selector styled-chart-labels temperature-sf-ny two-axes-vr two-axes"
but to me the axis-y label text display in horizontal align, what can be happening?.
Thanks
At this point, stackoverflow is your best bet for a solution.
Delete